I started this blog in 2009; I now have some additional resources so I thought I might revisit and revise some of my earlier posts. For instance, when I first wrote about complete games, Baseball-Reference.com’s Play Index data base went back only to 1954. It now goes back to 1913, meaning I can paint a more complete picture.
For those of you under the age of 30, a pitcher is given credit for a “complete game” if he is his team’s only pitcher in a game. I don’t think there’s anything inherently better or more manly about the idea of a pitcher going all nine (or more) innings rather than having help from the bullpen. But the game has really changed from just a couple generations ago, and I’m going to include some numbers here that will boggle the mind if the only baseball you know is that of the 21st century.
In 1913, when the current Play Index database begins, 53% of all starting pitchers worked a complete game, and from there the number rose as high as 63% in the war-shortened 1918 season. Since the percentage of complete games has slowly but steadily decreased, dropping below 50% in 1923, below 40% in 1947, below 30% in 1957, below 20% in 1981 (the advent of the designated hitter rule in 1973 helped prop up American League complete games for a while), below 10% in 1991 and below 5% in 2001. Last season (2015) there were just 104 complete games in 4,858 starts, or 2.1%. In other words, complete games were more than 25 times as likely in 1913 and about five times as likely as recently as 1990. You can see the whole story, along with other relevant stats from each season, here.
At any rate, in the lists that follow, we’re not going to see any pitchers who worked in the last 30 years.
Let’s start with the pitchers who, since 1913, have the most complete game wins — and for this purpose I’m going to specify complete games of at least nine innings, so as to exclude games shortened because of weather, darkness, or other reasons. (In all of these charts, when you see “Ind. Games,” click on that link to see details for all the individual games in question.) The first name on this list blows my mind.
| Player | #Matching | SHO | IP | HR | Tm | |||
|---|---|---|---|---|---|---|---|---|
| Warren Spahn | 321 | Ind. Games | 1.56 | 63 | 2909.0 | 148 | 0.96 | BSN,MLN,NYM,SFG |
| Pete Alexander | 293 | Ind. Games | 1.34 | 77 | 2711.0 | 50 | 0.92 | PHI,CHC,STL |
| Robin Roberts | 236 | Ind. Games | 1.83 | 45 | 2151.0 | 145 | 0.91 | PHI,BAL,HOU,CHC |
| Ted Lyons | 236 | Ind. Games | 2.05 | 26 | 2152.0 | 77 | 1.09 | CHW |
| Walter Johnson | 235 | Ind. Games | 1.28 | 75 | 2183.0 | 31 | 0.90 | WSH |
| Lefty Grove | 235 | Ind. Games | 1.89 | 33 | 2150.0 | 64 | 1.08 | PHA,BOS |
| Burleigh Grimes | 232 | Ind. Games | 1.99 | 35 | 2114.0 | 56 | 1.12 | BRO,NYG,PIT,BSN,STL,CHC |
| Gaylord Perry | 225 | Ind. Games | 1.22 | 53 | 2040.0 | 73 | 0.85 | SFG,CLE,TEX,SDP,ATL,SEA,KCR |
| Red Ruffing | 223 | Ind. Games | 1.90 | 43 | 2038.0 | 68 | 1.06 | BOS,NYY |
| Early Wynn | 222 | Ind. Games | 1.31 | 49 | 2015.0 | 77 | 0.97 | WSH,CLE,CHW |
| Bob Feller | 218 | Ind. Games | 1.63 | 43 | 1977.0 | 67 | 1.04 | CLE |
| Steve Carlton | 215 | Ind. Games | 1.38 | 55 | 1940.0 | 72 | 0.92 | STL,PHI,CLE |
| Carl Hubbell | 211 | Ind. Games | 1.66 | 35 | 1924.0 | 87 | 0.95 | NYG |
| Fergie Jenkins | 208 | Ind. Games | 1.42 | 49 | 1877.0 | 112 | 0.82 | CHC,BOS,TEX |
| Juan Marichal | 206 | Ind. Games | 1.45 | 52 | 1873.0 | 110 | 0.85 | SFG |
| Eppa Rixey | 202 | Ind. Games | 1.49 | 34 | 1861.0 | 20 | 1.01 | PHI,CIN |
| Red Faber | 200 | Ind. Games | 1.66 | 29 | 1843.0 | 32 | 1.06 | CHW |
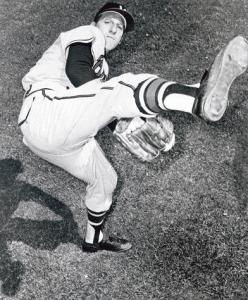
Apparently this photo of Warren Spahn was taken without the use of a drone
Only 14 other pitchers in major league history have won more than 321 games in any form. Warren Spahn had 321 COMPLETE GAME wins of nine innings or more (and 10 of them went ten innings or more)…88% of his total career wins. Wow. Who needs a bullpen? Throw in the fact that Spahn earned five wins in relief, and that leaves just 37 games Spahn won as a starter in which he did not pitch a complete game of at least nine innings…out of 665 career starts. And look: in those 321 complete game wins, nearly 3,000 innings of pitching — the equivalent of about 15 SEASONS for a modern starting pitcher — Spahn had a 1.56 ERA.
Among recent pitchers, Greg Maddux had 355 career wins — just eight fewer than Spahn — and Roger Clemens finished with 354. But Maddux had just 91 complete game wins of nine innings or more (only one of them more) and Clemens only 92 (all of them nine innings),. Maddux had the same number of career complete game wins as Larry Dierker, who had just 139 total wins in the 1960s and ’70s. Clemens had fewer complete game wins than Denny McLain, whose career victory total in that same era was just 131. The active (as of 2016) leader in career complete games, CC Sabathia, has merely 27 complete game wins of nine innings (and none of more) among his 214 career victories. Things have changed. A lot.
Of course, the list above goes back only to 1913, and Spahn is not likely the all-time major league leader in complete game wins. Of the 14 other pitchers with more than 321 total wins, seven spent all or nearly all their careers before 1913, when complete games were much more likely (back in the 19th century, starting pitchers completed well over 80% of their games); several of them, led by all-time wins leader Cy Young, likely have more complete game wins. And Spahn is probably not even the all-time leader among pitchers on this list.
Grover Cleveland Alexander won 47 games in his first two seasons in the majors (1911-12) and threw 56 complete games. While he also had 17 non-save relief appearances, some of which may have resulted in victories, I’d guess he had enough complete game wins in those seasons to pass Spahn when combined with his 293 complete game wins from 1913 on. And Walter Johnson likely has even more. While he is 86 behind Spahn from 1913 on, he won 115 games from 1907-12 and pitched 169 complete games, finishing 87% of his starts. While he had 25 non-save relief appearances, I’d wager to say the vast majority of those pre-1913 wins were complete games.
Ted Lyons
Ted Lyons is worth a mention here. Complete games of nine or more innings accounted for 91% of the longtime White Sox star’s career victories. In his career Lyons won only nine games he started and did not pitch a complete game of at least nine innings (he won 15 games in relief). And in one of those nine wins, he went 14-1/3 innings, the longest outing of his career. That leaves EIGHT of Lyons’ 245 career wins as a starter in which he didn’t pitch at least nine innings. Whoa.
Over the last decade or so of Lyons’ career he was known as a “Sunday pitcher,” typically starting only one game a week and typically finishing what he started. In fact, Lyons pitched a complete game in each of his last 28 career starts and in nearly three-quarters of his career starts.
Gaylord Perry is the first pitcher on this list whose career extended past 1966 (in his case, 1983). Jim Bunning and Catfish Hunter each won 224 games in their Hall of Fame careers. Gaylord Perry won 225 COMPLETE GAMES of at least nine innings (with an astounding ERA of 1.22 in more than 2,000 innings). That’s more wins than 19 Hall of Fame 20th Century starters, including Bunning and Hunter, earned in their entire careers.
Next let’s look at career complete game losses…in this case we’ll consider performances of eight innings or longer to account for complete game losses on the road.
| Player | #Matching | IP | Tm | |||
|---|---|---|---|---|---|---|
| Walter Johnson | 121 | Ind. Games | 2.86 | 1071.2 | 1.20 | WSH |
| Ted Lyons | 119 | Ind. Games | 4.00 | 1063.2 | 1.42 | CHW |
| Red Ruffing | 107 | Ind. Games | 4.10 | 941.0 | 1.35 | BOS,NYY,CHW |
| Wilbur Cooper | 90 | Ind. Games | 3.02 | 789.1 | 1.21 | PIT,CHC |
| Burleigh Grimes | 78 | Ind. Games | 3.55 | 673.2 | 1.41 | PIT,BRO,NYG,STL,CHC |
| Pete Alexander | 78 | Ind. Games | 3.27 | 689.0 | 1.23 | PHI,CHC,STL |
| Gaylord Perry | 76 | Ind. Games | 3.05 | 661.1 | 1.10 | SFG,CLE,TEX,SDP,SEA |
| Bert Blyleven | 74 | Ind. Games | 3.16 | 629.0 | 1.14 | MIN,TEX,PIT,CLE,CAL |
| Eppa Rixey | 73 | Ind. Games | 2.93 | 654.1 | 1.29 | PHI,CIN |
| Red Lucas | 72 | Ind. Games | 3.76 | 634.1 | 1.31 | BSN,CIN,PIT |
| Howard Ehmke | 72 | Ind. Games | 4.29 | 619.0 | 1.47 | DET,BOS,PHA |
| Hooks Dauss | 72 | Ind. Games | 3.68 | 630.2 | 1.39 | DET |
| Bullet Joe Bush | 72 | Ind. Games | 3.55 | 618.2 | 1.35 | PHA,BOS,NYY,SLB,WSH,PIT |
| Sad Sam Jones | 71 | Ind. Games | 3.77 | 628.1 | 1.39 | BOS,NYY,SLB,WSH,CHW |
Warren Spahn, who topped our complete game wins leaderboard, doesn’t even show up here as he had only 57 complete game losses (with a 2.73 ERA in those games). Note Walter Johnson’s stats in his complete game losses…he had a 0-121 record with a 2.86 ERA! That speaks to both the low scoring of his era and his lack of offensive support. Gaylord Perry, the “modern” leader in complete game losses, had an excellent 1.10 WHIP in those games.
Now on to complete game wins in a season…in a three-year stretch Grover Cleveland Alexander posted the top three totals in the database.
| Player | Year | #Matching | SHO | IP | Tm | |||
|---|---|---|---|---|---|---|---|---|
| Pete Alexander | 1916 | 33 | Ind. Games | 0.83 | 16 | 302.0 | 0.82 | PHI |
| Pete Alexander | 1917 | 30 | Ind. Games | 1.10 | 8 | 278.0 | 0.90 | PHI |
| Denny McLain | 1968 | 28 | Ind. Games | 1.46 | 6 | 253.0 | 0.83 | DET |
| Pete Alexander | 1915 | 28 | Ind. Games | 0.83 | 11 | 260.0 | 0.75 | PHI |
| Dazzy Vance | 1924 | 27 | Ind. Games | 1.59 | 3 | 249.0 | 0.94 | BRO |
| Robin Roberts | 1952 | 27 | Ind. Games | 2.24 | 3 | 253.0 | 0.96 | PHI |
| Bucky Walters | 1939 | 26 | Ind. Games | 1.78 | 2 | 237.0 | 1.02 | CIN |
| Carl Mays | 1921 | 26 | Ind. Games | 2.33 | 1 | 236.0 | 1.10 | NYY |
| Bob Feller | 1946 | 26 | Ind. Games | 1.10 | 10 | 237.0 | 1.03 | CLE |
| Eddie Cicotte | 1919 | 26 | Ind. Games | 0.96 | 5 | 244.0 | 0.89 | CHW |
| Pete Alexander | 1920 | 26 | Ind. Games | 0.92 | 7 | 253.0 | 0.96 | CHC |
| George Uhle | 1926 | 25 | Ind. Games | 1.70 | 3 | 227.0 | 1.11 | CLE |
| Urban Shocker | 1921 | 25 | Ind. Games | 2.04 | 4 | 225.0 | 1.08 | SLB |
| Hal Newhouser | 1946 | 25 | Ind. Games | 1.15 | 6 | 227.0 | 0.91 | DET |
| Sandy Koufax | 1965 | 25 | Ind. Games | 1.15 | 8 | 226.0 | 0.72 | LAD |
| Lefty Grove | 1931 | 25 | Ind. Games | 1.66 | 4 | 228.0 | 1.04 | PHA |
| Bob Feller | 1940 | 25 | Ind. Games | 1.76 | 4 | 225.0 | 1.00 | CLE |
Note 16 of Alexander’s 33 complete game wins in 1916 were shutouts…that’s the all-time single season record. He went the distance in 91 of his 94 wins from 1915-17, leading the National League in wins, complete games, shutouts, ERA, innings pitched and strikeouts each year. Alexander went into the Army in 1918 during World War I and was left deaf in his left ear and with muscle damage in his pitching arm, but he came back from the war to win another 181 games.
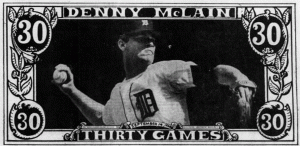
From the Detroit Free Press the morning after Denny McLain’s 30th win in 1968
When Denny McLain became the last pitcher to win 30 games in a season in 1968 (he won 31), all 28 of his complete games were victories. In his other 13 starts he went 3-6, winning games in which he pitched 7, 7 and 6 innings.
All 26 of Bob Feller‘s wins in 1946 were complete games, as were 25 of his 27 wins in 1940.
These are the pitchers who have had at least 20 complete game wins in a season since 1960:
| Player | Year | #Matching | SHO | IP | Tm | |||
|---|---|---|---|---|---|---|---|---|
| Denny McLain | 1968 | 28 | Ind. Games | 1.46 | 6 | 253.0 | 0.83 | DET |
| Sandy Koufax | 1965 | 25 | Ind. Games | 1.15 | 8 | 226.0 | 0.72 | LAD |
| Juan Marichal | 1968 | 24 | Ind. Games | 1.40 | 5 | 219.0 | 0.87 | SFG |
| Sandy Koufax | 1966 | 24 | Ind. Games | 1.00 | 5 | 216.0 | 0.91 | LAD |
| Fergie Jenkins | 1971 | 24 | Ind. Games | 1.87 | 3 | 217.0 | 0.87 | CHC |
| Steve Carlton | 1972 | 24 | Ind. Games | 0.99 | 8 | 218.0 | 0.85 | PHI |
| Juan Marichal | 1966 | 23 | Ind. Games | 1.53 | 4 | 212.0 | 0.78 | SFG |
| Mickey Lolich | 1971 | 22 | Ind. Games | 1.43 | 4 | 201.0 | 1.00 | DET |
| Fergie Jenkins | 1974 | 22 | Ind. Games | 1.23 | 6 | 198.0 | 0.80 | TEX |
| Bob Gibson | 1968 | 22 | Ind. Games | 0.57 | 13 | 204.0 | 0.76 | STL |
| Warren Spahn | 1963 | 21 | Ind. Games | 1.62 | 7 | 189.0 | 0.94 | MLN |
| Gaylord Perry | 1970 | 21 | Ind. Games | 1.33 | 5 | 189.0 | 0.80 | SFG |
| Juan Marichal | 1965 | 21 | Ind. Games | 0.85 | 10 | 190.0 | 0.77 | SFG |
| Gaylord Perry | 1972 | 20 | Ind. Games | 0.92 | 5 | 185.0 | 0.85 | CLE |
| Gaylord Perry | 1974 | 20 | Ind. Games | 1.15 | 4 | 180.0 | 0.83 | CLE |
| Denny McLain | 1969 | 20 | Ind. Games | 1.25 | 9 | 180.0 | 0.90 | DET |
| Juan Marichal | 1964 | 20 | Ind. Games | 1.79 | 4 | 181.0 | 0.92 | SFG |
| Juan Marichal | 1969 | 20 | Ind. Games | 1.15 | 8 | 180.0 | 0.81 | SFG |
| Mickey Lolich | 1972 | 20 | Ind. Games | 1.25 | 4 | 180.0 | 0.98 | DET |
| Frank Lary | 1961 | 20 | Ind. Games | 1.85 | 4 | 180.0 | 0.96 | DET |
| Sandy Koufax | 1963 | 20 | Ind. Games | 0.69 | 11 | 183.0 | 0.64 | LAD |
| Bob Gibson | 1969 | 20 | Ind. Games | 1.34 | 4 | 188.0 | 0.98 | STL |
| Bob Gibson | 1970 | 20 | Ind. Games | 1.65 | 3 | 185.0 | 0.89 | STL |
| Vida Blue | 1971 | 20 | Ind. Games | 1.20 | 7 | 180.0 | 0.86 | OAK |
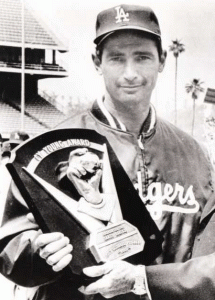
Sandy Koufax with one of his three Cy Young Awards
Sandy Koufax won the Cy Young Award in 1963, 1965 and 1966 — back when there was only one award, going to the pitcher voted the best in all the major leagues. Of his 78 wins in those seasons, 69 were complete games (24 of them shutouts)…and his ERA in those 69 games was 0.96. Juan Marichal won at least 20 complete games five times in six years from 1964-69. All 24 of Ferguson Jenkins‘ wins in 1971 were complete games. Jenkins and Gaylord Perry are the last men to win 20 complete games in a season, both in 1974; Perry, Steve Carlton and Mickey Lolich were the last to do it without a designated hitter, in 1972.
Then there’s Bob Gibson‘s heralded 1968 season in which he posted a 1.12 ERA. All 22 of his wins were complete games, three of them going extra innings. Gibby tossed 13 shutouts (five of them coming in consecutive starts) and gave up no more than one run in 20 of the 22 complete game wins, giving him an ERA in his wins of 0.57. (In his other 12 starts he allowed more than three runs only three times.)
Now on to the most complete game losses in a season (at least eight innings):
| Player | Year | #Matching | IP | Tm | |||
|---|---|---|---|---|---|---|---|
| Elmer Myers | 1916 | 19 | Ind. Games | 3.84 | 164.0 | 1.39 | PHA |
| Jim Tobin | 1942 | 16 | Ind. Games | 4.44 | 140.0 | 1.34 | BSN |
| Red Ruffing | 1928 | 15 | Ind. Games | 4.27 | 132.2 | 1.42 | BOS |
| Eppa Rixey | 1920 | 15 | Ind. Games | 4.35 | 130.1 | 1.41 | PHI |
| Red Lucas | 1932 | 15 | Ind. Games | 3.09 | 137.0 | 1.28 | CIN |
| Walter Johnson | 1916 | 15 | Ind. Games | 2.24 | 136.1 | 1.15 | WSH |
| Eddie Cicotte | 1918 | 15 | Ind. Games | 3.20 | 132.1 | 1.28 | CHW |
| George Baumgardner | 1913 | 15 | Ind. Games | 3.40 | 132.1 | 1.47 | SLB |
| Jack Quinn | 1915 | 14 | Ind. Games | 3.18 | 121.2 | 1.24 | BAL |
| Scott Perry | 1918 | 13 | Ind. Games | 2.94 | 110.1 | 1.33 | PHA |
| Walter Johnson | 1914 | 13 | Ind. Games | 2.18 | 111.2 | 1.06 | WSH |
| Walter Johnson | 1917 | 13 | Ind. Games | 2.72 | 112.1 | 1.02 | WSH |
| Wes Ferrell | 1937 | 13 | Ind. Games | 3.63 | 114.0 | 1.47 | BOS,WSH |
| Howard Ehmke | 1925 | 13 | Ind. Games | 4.04 | 111.1 | 1.41 | BOS |
| Jesse Barnes | 1917 | 13 | Ind. Games | 2.54 | 110.0 | 1.01 | BSN |
The 1916 Philadelphia A’s had the worst record of any team in the 20th Century (or 21st, for that matter), finishing with a 36-117 mark. They scored the fewest runs in the American League, averaging less than three runs a game. You’d think that combination would mean they would be pinch-hitting for their pitchers a lot. You’d be wrong. Manager (and team owner) Connie Mack let his starters complete 94 of their 154 games, by far the most in the league.
From the Kalamazoo Gazette, June 7, 1916
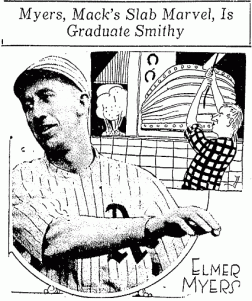
And the man who led the A’s in complete games was Elmer Myers, a 22-year-old rookie who finished 31 of his 35 starts. Mack brought Myers up from a Class D league in September 1915 after Myers had won 29 games there; he used his newcomer in the A’s last game of the season and was delighted to see him pitch a two-hit shutout. When Myers started the 1916 season with a 6-1 record (the rest of the team was 7-16 at that point), Mack figured he was on to something special.
“Myers is the greatest young pitcher I have ever developed,” Mack was quoted as saying in an article in the Kalamazoo Gazette in June. The article concluded, “Mack predicts that before the season is over Myers will rank with Walter Johnson and Grover Alexander.”
Alas Myers went 8-22 over the rest of the season, while Johnson won 25 games for Washington and Alexander 33 for the Phillies. (Myers’ 23 losses didn’t lead the AL, though; that distinction fell to teammate Bullet Joe Bush, who went 15-24. The rest of the A’s pitching staff went 7-70. Yes, seven and seventy. No other pitcher on the team won more than two games.)
Mack was never shy about leaving his starting pitchers in to take a pounding. Myers allowed seven or more runs in seven of his complete games (including a game he won, 10-8). The worst drubbing came on September 27, when Myers gave up 17 hits and walked six in a 13-3 loss to Washington. Or, as Jim Nasium (really?) put it in the next day’s Philadelphia Inquirer, “when Elmer wasn’t striking them out they were in there whaling the dad-binged stuffings out of the pill.”
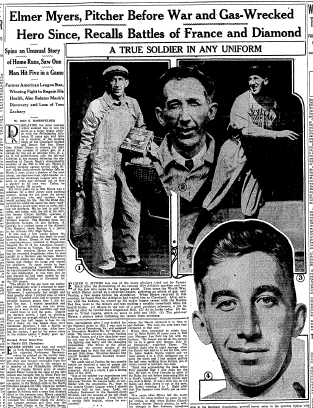
A story focusing on Elmer Myers’ war experience in The Sporting News, December 19, 1940
Myers pitched in the major leagues until 1922, although he missed time to fight in World War I where he was victim of a poison gas attack by the Germans in Verdun. Bill Nowlin tells Myers’ story as part of the Society for American Baseball Research’s Baseball Biography Project.
Jim Tobin led the National League in complete games and losses for the 1942 Boston Braves, going all the way in 28 of his 33 starts and losing 16 of those games. Of course, manager Casey Stengel had motivation to leave Tobin in the game, as Tobin was one of his better hitters. He finished the season with a .246 batting average (the team average was .240) and six home runs in 114 at-bats.
Red Ruffing also used his bat to stay in the game for the 1928 Red Sox, as he hit .314 and drove in 19 runs in 121 at-bats (he also saw frequent duty a a pinch-hitter). A future star with the Yankees and a Hall of Famer, Ruffing went 10-25 for the last-place ’28 Sox, leading the AL in losses and complete games.
Red Lucas was another good-hitting pitcher who racked up a lot of complete game losses. Lucas finished 28 of his 31 starts for the last-place 1932 Reds (“last-place” is something a lot of pitchers on this list have in common) while hitting .287 and leading the team in pinch-hit appearances. Lucas won 157 games in the major leagues and also held the all-time record for career pinch-hits until the 1960s.
Only two pitchers on the list of most complete game losses had a winning record in the season in question: Walter Johnson (who had a winning record in all three of his seasons on the list) and Scott Perry. Perry was a 27-year-old who had 43-2/3 innings of major league experience when he joined the A’s in 1918. Even though he pitched for a last-place team (although not nearly as bad as they had been in 1916), Perry went 20-19 with a 1.98 ERA, led the league in innings pitched and completed 30 of his 36 starts (both of which led the league) in a season called off at Labor Day because of World War I. He had some success early in the season (including an 11-inning shutout and a one-hitter a week apart) before a nine-game losing streak left him at 5-14, but he rallied to win 15 of his next 19 decisions.
Whatever magic struck Perry in 1918 never returned; he went 4-17 in 1919, 11-25 in 1920, then announced he was finished playing organized baseball midway through the 1921 season.
Let’s look at the pitchers with the most complete game losses in a season since World War II:
| Player | Year | #Matching | IP | Tm | |||
|---|---|---|---|---|---|---|---|
| Mickey Lolich | 1974 | 11 | Ind. Games | 4.14 | 95.2 | 1.28 | DET |
| Johnny Lindell | 1953 | 11 | Ind. Games | 3.87 | 95.1 | 1.52 | PIT,PHI |
| Rick Langford | 1980 | 11 | Ind. Games | 3.67 | 95.2 | 1.29 | OAK |
| Catfish Hunter | 1975 | 11 | Ind. Games | 3.23 | 92.0 | 1.15 | NYY |
| Ned Garver | 1950 | 11 | Ind. Games | 3.69 | 100.0 | 1.49 | SLB |
| Clyde Wright | 1974 | 10 | Ind. Games | 3.11 | 84.0 | 1.25 | MIL |
| Wilbur Wood | 1974 | 10 | Ind. Games | 2.63 | 89.0 | 1.12 | CHW |
| Nolan Ryan | 1974 | 10 | Ind. Games | 2.40 | 90.0 | 1.18 | CAL |
| Nolan Ryan | 1977 | 10 | Ind. Games | 3.71 | 87.1 | 1.42 | CAL |
| Gaylord Perry | 1973 | 10 | Ind. Games | 4.98 | 85.0 | 1.39 | CLE |
| Phil Niekro | 1979 | 10 | Ind. Games | 3.27 | 85.1 | 1.30 | ATL |
| Mickey Lolich | 1975 | 10 | Ind. Games | 3.64 | 84.0 | 1.24 | DET |
| Roger Craig | 1963 | 10 | Ind. Games | 1.94 | 83.1 | 0.96 | NYM |
| Ken Brett | 1976 | 10 | Ind. Games | 3.30 | 84.2 | 1.29 | CHW |
Note that of the 14 pitchers in double digits, 10 of the pitched in the American League in the early years of the designated hitter — four of them just in 1974. Wilbur Wood and Nolan Ryan deserve special mention here, as their ERAs in their complete game losses were lower than their overall season ERA. Wood’s ERA in his CGL (2.63) was almost identical to his mark in his 20 wins (2.61).
Look at poor Roger Craig with the 1963 Mets: a 1.94 ERA in 10 complete game losses, including four games he lost 1-0! Roger had a 5-22 record for a team that went 51-111; his ERA in his five wins was 2.81.
One last note: Hall of Famer Lefty Grove had seven complete game wins in games that were called before nine innings were played, the most such games of anyone in the database.

Pingback: A few things about complete games | The J.G. Preston Experience